How to Generate Actionable Insights from Your Data
Today, we'll walk through a structured method to help you turn data into valuable insights.
TL;DR
Transforming your data into actionable insights is crucial for business success. By following a structured process of defining hypotheses, planning and performing analyses, calculating the relative impact, and iterating as needed, you can uncover valuable insights that drive your business forward.
Hello Growth and Product Enthusiasts!
Understanding how to generate actionable insights from your data can be a game-changer for your business. It's a nuanced process, but with a systematic approach, you can transform ambiguous data into clear, strategic actions that drive success. Today, we'll walk through a structured method to help you turn data into valuable insights.
The Insight Generation Loop
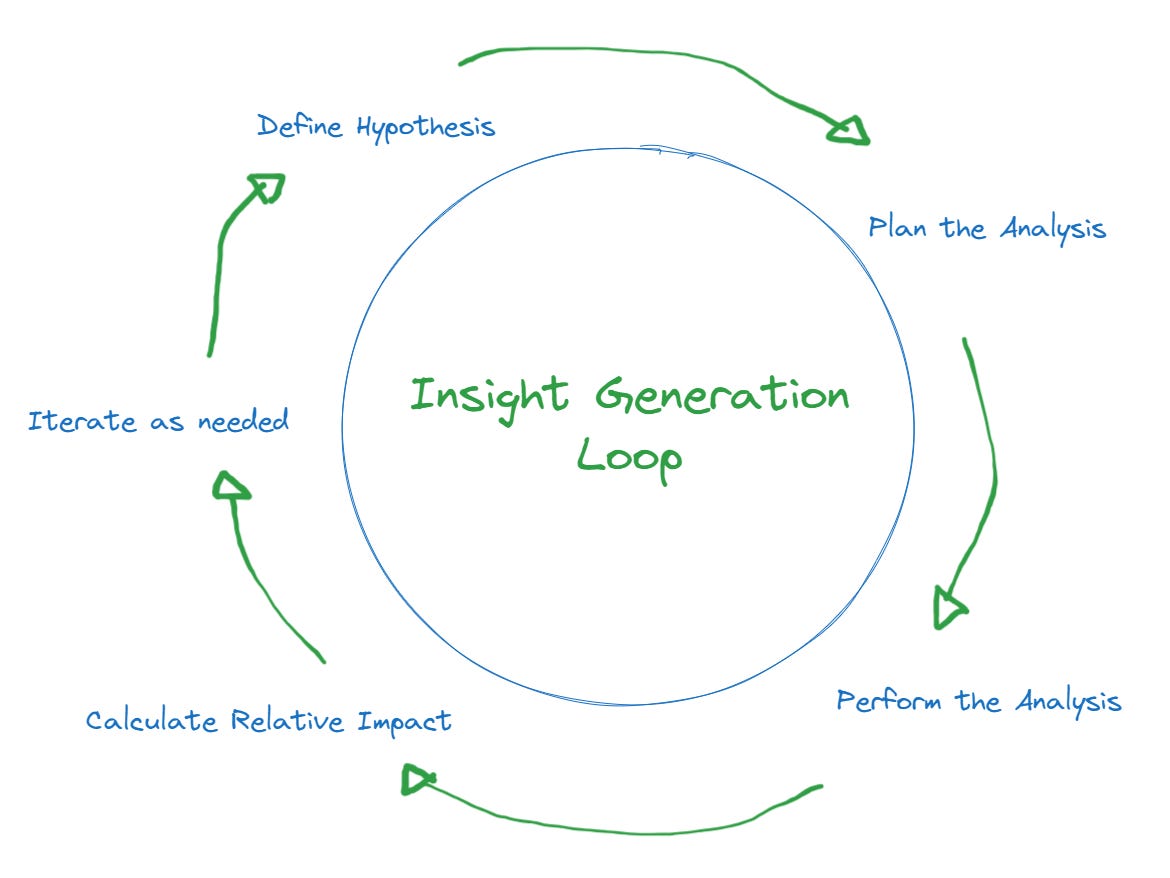
Generating insights can be daunting, but by thinking of it as an insight generation loop, you can bring clarity to the process. Here’s a step-by-step approach:
1. Define Your Hypotheses
Your hypotheses are the backbone of your analysis. Here’s how to focus them:
Prioritize Metrics: Choose metrics aligned with your key results and goals. Focus on areas where you lack information.
Ask Broad Questions: Start with broad questions about why you aren't meeting your goals.
Brainstorm Hypotheses: Think of conventional (plausible and realistic) and unconventional (imaginative and creative) hypotheses.
Narrow Down: Validate that your hypotheses are meaningful, debatable, and testable.
Example: FoodFusion Case Study
John, the Search and Recommendations PM at FoodFusion, aims to improve the search-to-order conversion rate. FoodFusion is a leading food delivery app in the USA, similar to DoorDash and GrubHub. By asking why the search-to-order rate isn’t hitting the 30% target, John brainstorms and narrows down his hypotheses.
2. Plan Your Analysis
Once your hypotheses are defined, plan how to test them:
Identify Data Sets: Choose the right data sets and ensure they’re reliable.
Specify Variables: Define your input variables and control for confounding factors.
Types of Analysis:
Funnel Analysis: Examine user behavior from the initial search to order confirmation. Identify drop-off points.
Segmentation Analysis: Segment data based on different variables like ETA, price, or ratings to see how they impact user behavior.
A/B Testing: Test different versions of features or interfaces to see which performs better.
Correlation Analysis: Determine the relationship between variables (e.g., how ETA affects conversion rates).
Example: FoodFusion Case Study
John and his data analyst, Mike, prioritize data sets for ETA, rating, and surge pricing. They clean and prepare the data for analysis, focusing on sessions with at least one high and one low ETA restaurant to validate user behavior.
3. Perform the Analysis
Execute your planned analysis and interpret the results:
Establish Baseline: Understand what is "normal" before analyzing.
Run Analysis: Execute the analysis and capture the outputs.
Interpret Results: Determine if your hypotheses are supported by the data.
Detailed Analysis Steps:
Funnel Analysis: Mike sets up a funnel analysis to understand where users drop off in the process. He looks at the conversion rates from each step: search, view results, add to cart, review order, and confirm order. This helps identify where the biggest issues lie.
Segmentation Analysis: Mike segments the data by ETA and surge pricing. For ETA, he creates bins (e.g., 0-10 minutes, 11-20 minutes, etc.) and analyzes how each impacts the likelihood of adding items to the cart and confirming an order. For surge pricing, he does a similar segmentation to see how price changes affect behavior.
A/B Testing: John runs tests to see if showing ETA directly in the search results improves conversion rates compared to the current setup where ETA is only shown on the restaurant page.
Correlation Analysis: Mike performs a correlation analysis to see how different factors (e.g., restaurant ratings, price, ETA) correlate with conversion rates. This helps identify which factors have the strongest impact.
Example: FoodFusion Case Study
Mike conducts a funnel analysis to establish a baseline and then performs segmentation analysis on ETA and surge pricing. The results show that higher ETA and surge pricing negatively impact conversion rates.
4. Calculate the Relative Impact
Quantify the significance of your findings:
Measure Impact: Assess the practical significance and how it affects key metrics.
Contextualize Results: Ensure your findings apply to relevant user segments.
Steps for Calculating Impact:
Define Denominators: Determine the total user base or sessions your findings apply to.
Quantify Changes: Calculate the potential increase in conversion rates or other key metrics based on your findings.
Segment Analysis: Ensure the results are relevant across different user segments (e.g., new users vs. returning users).
Example: FoodFusion Case Study
John and Mike calculate the potential impact of improving ETA visibility on the search-to-order conversion rate. They project a significant increase in confirmed orders by prioritizing restaurants with ETAs ≤ 40 minutes.
5. Iterate as Needed
Revisit and refine your hypotheses and analysis:
Adjust Hypotheses: Based on your findings, refine your hypotheses.
Correct Flaws: Identify and correct any issues in your analysis.
Explore Further: If the analysis is ambiguous, pivot to new hypotheses or different metrics.
Recap
Define Hypotheses: Focus on key metrics and brainstorm both conventional and unconventional explanations.
Plan Analysis: Choose reliable data sets and define clear variables.
Perform Analysis: Establish a baseline, execute the analysis, and interpret the results.
Calculate Impact: Quantify the significance and ensure applicability to relevant segments.
Iterate: Refine and repeat the process to deepen your insights.
With this structured approach, you can unlock the hidden potential in your data, turning it into actionable insights that drive your business forward.
Stay Curious,
Sebastián.


